What do rising insolvency filings mean for the economy?
Connecting the Dots: from Insolvencies to Recessions, Inflation and the Bank of England's Rate Decisions
The bigger picture
Although the news about inflation in the UK has recently been better than expected (August inflation was the lowest since February) let's take a step back and consider a wider perspective.
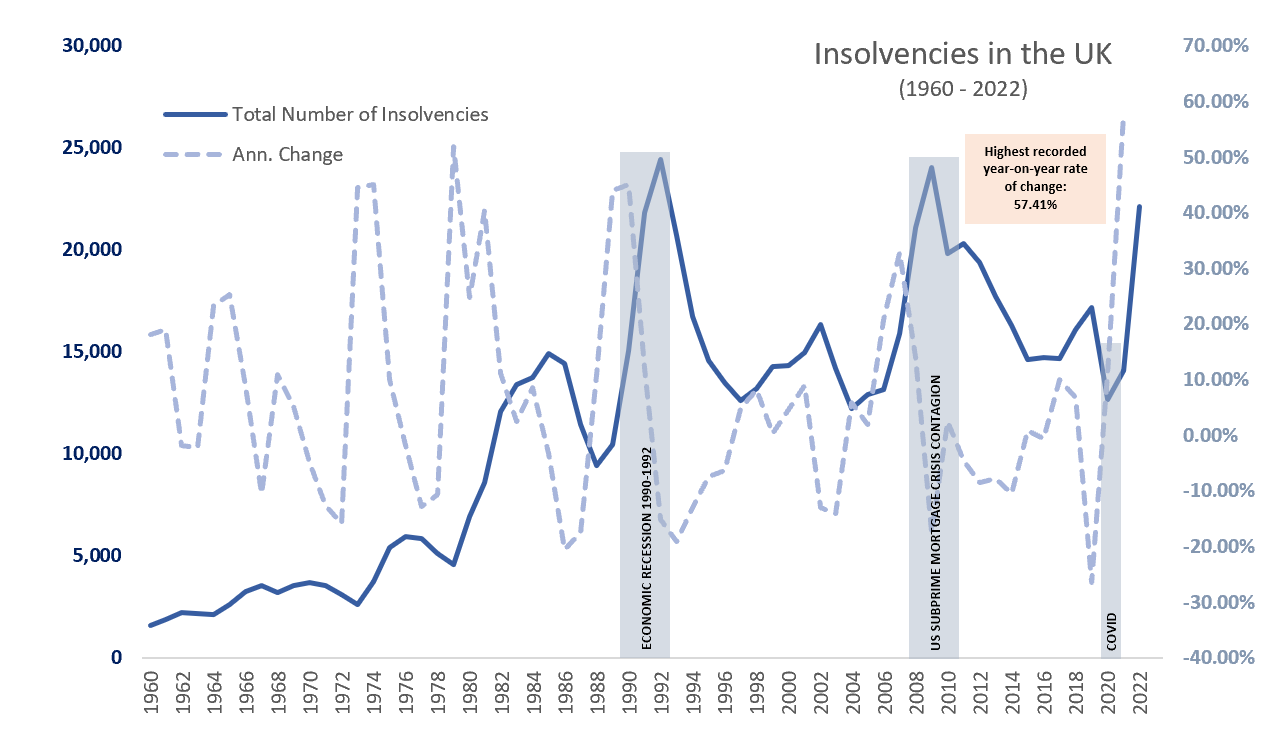
Insolvency statistical data highlights a significant surge in company insolvencies, with 2022 marking the highest levels in over a decade, increasing 57% year on year to over 22,000. This is the highest level seen since 2009. The year-on-year change is also the most substantial since 1960 in terms of companies facing insolvency.
In absolute terms, we are still not at the levels seen during the 1990 recession (where we witnessed high inflation, falling house prices and an overvalued exchange rate - a scenario that somewhat resembles what we are seeing today), and fortunately we are also far from experiencing the magnitude of the impact seen during the US Subprime Mortgage Crisis.
“When the sub prime crisis hit America, those markets took fright, and stopped lending to anything that looked like it might be over-exposed to the housing market. Northern Rock was an obvious first casualty”
BBC: The collapse of the Northern Rock- 10 years on
Although 2008 was the year the recession deepened, this started brewing earlier with signs coming up in 2007 with BNP Paribas announcing they will cease activity in three US mortgage debt funds, citing liquidity issues and lack of clarity in how to value the holdings. By September 2007, this lack of liquidity spread to the UK market impacting Northern Rock (a building society turned bank) causing the first UK bank run for over 140 years. This triggered its own set of consequences causing a financial crisis of its own via financial contagion.
While it is somewhat evident that there exists a mutually reinforcing negative cycle between insolvencies and the macroeconomic environment, discerning whether a surge in insolvencies triggers economic difficulties or if economic challenges drive these companies towards insolvency can be complex. Nevertheless, economic theory suggests that it is these adverse economic conditions that give rise to various difficulties.
With the exception of COVID in 2020 (shown in the rightmost vertical grey bar in the chart below), the highest insolvency points correspond to economic recessions. COVID19 was different as it started as a health and humanitarian crisis, definitely outside of the economic system but that made its way into it. The government's actions, such as implementing the furlough scheme, undoubtedly offered essential assistance and artificially subdued the level of insolvencies. It is probable that the substantial increase in insolvencies witnessed in 2022 is a belated outcome resulting from mitigating the immediate impact of COVID-19.

Consumer and Business Confidence - The OECD data
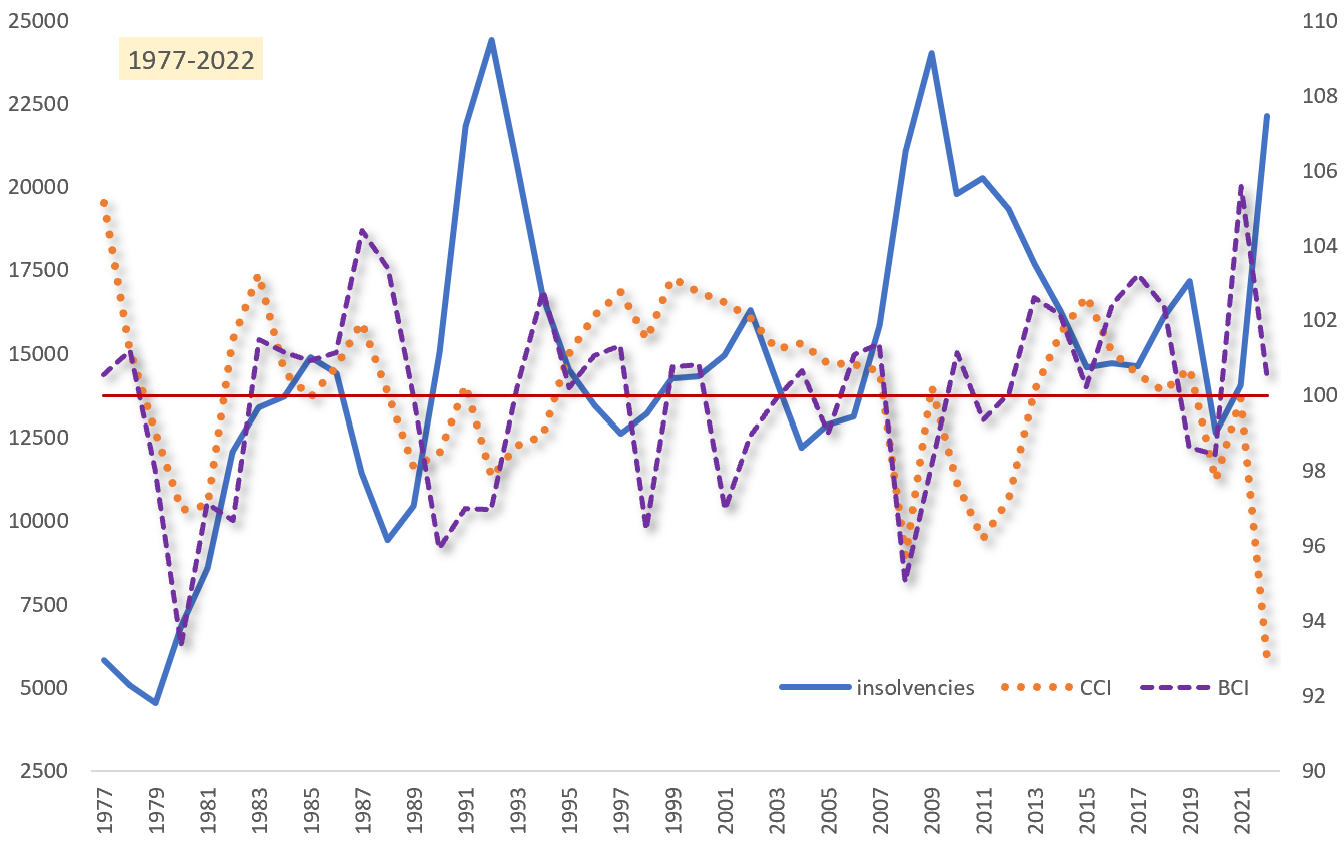
The Organisation for Economic Co-operation and Development (OECD) publishes, among other indicators, the Consumer Confidence Index (CCI) and Business Confidence Index (BCI). Both indicators are based on business tendency and consumer opinion surveys, and are read taking 100 as a reference point. In other words, when the indicator is above 100 this shows optimism, and below 100 it would reflect a pessimistic view.
Insolvencies vs Consumer and Business Confidence

From 1977 to 2022, both the CCI and BCI have mostly been above 100 and exhibited a negative correlation with the level of insolvencies - which is to be expected: as insolvencies go up, general confidence goes down. Thus far for 2023, the CCI is below 100 whilst the BCI appears relatively neutral (close to 100). Consumers appear to have lower expectations than businesses when it comes to better future economic conditions.
Looking back from 2000, this also becomes noticeable when compared with other European economies and the G-7 block (USA, Canada, the United Kingdom, France, Germany, Italy, and Japan). The UK’s CCI, although it recovered from 92.08 back in September 2022 (its lowest point in the history of the indicator), to 97.7 today, it still sits at the bottom of this list for 2023.

Inflation and Insolvencies
Inflation has undeniably been a prominent subject of discussion, more so than many would have preferred. With many Britons concerned about these historic inflation levels, this has become a popular topic of discussion. But what is the precise connection between inflation and insolvencies?
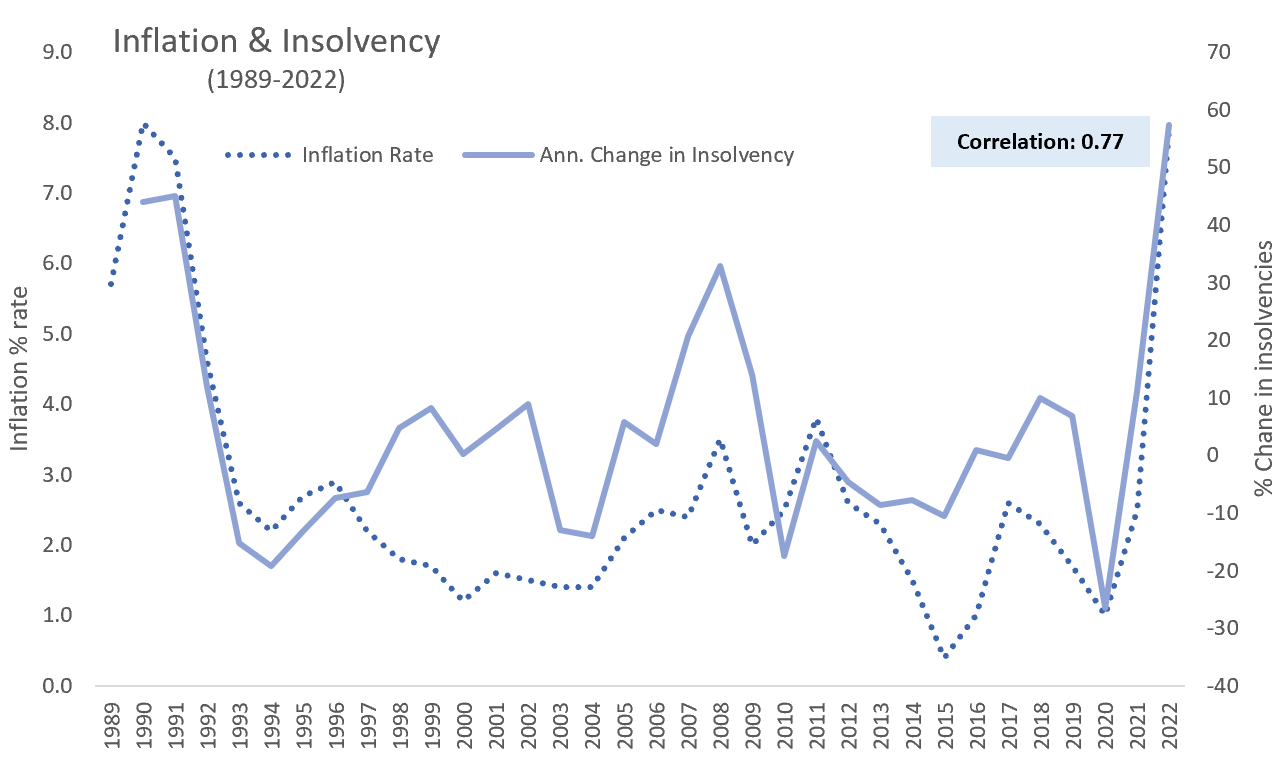
When overlapping the inflation time series with Insolvency change rate, we find that they display a positive correlation from 1989 to 2022 of 0.7767. This means that both series have mostly moved in the same direction through our time sample.

Although these two series tend to mirror each other, they operate on different scales. Insolvency figures have experienced more pronounced fluctuations compared to inflation. It appears probable that this is an indication of an economy burdened by debt or leverage.
On an annualised basis, in 2022 we reached a level of inflation not seen since the 1990s recession.
How is 2023 looking at the moment
The most recent monthly insolvency statistics published covers up to August 2023. Comparing the 2023 data with that 2022 we see that insolvencies are moderately higher (13.50% up on average). This illustrates a cautionary environment. With one quarter left to go, insolvencies are already at 74% of a decade-high point.
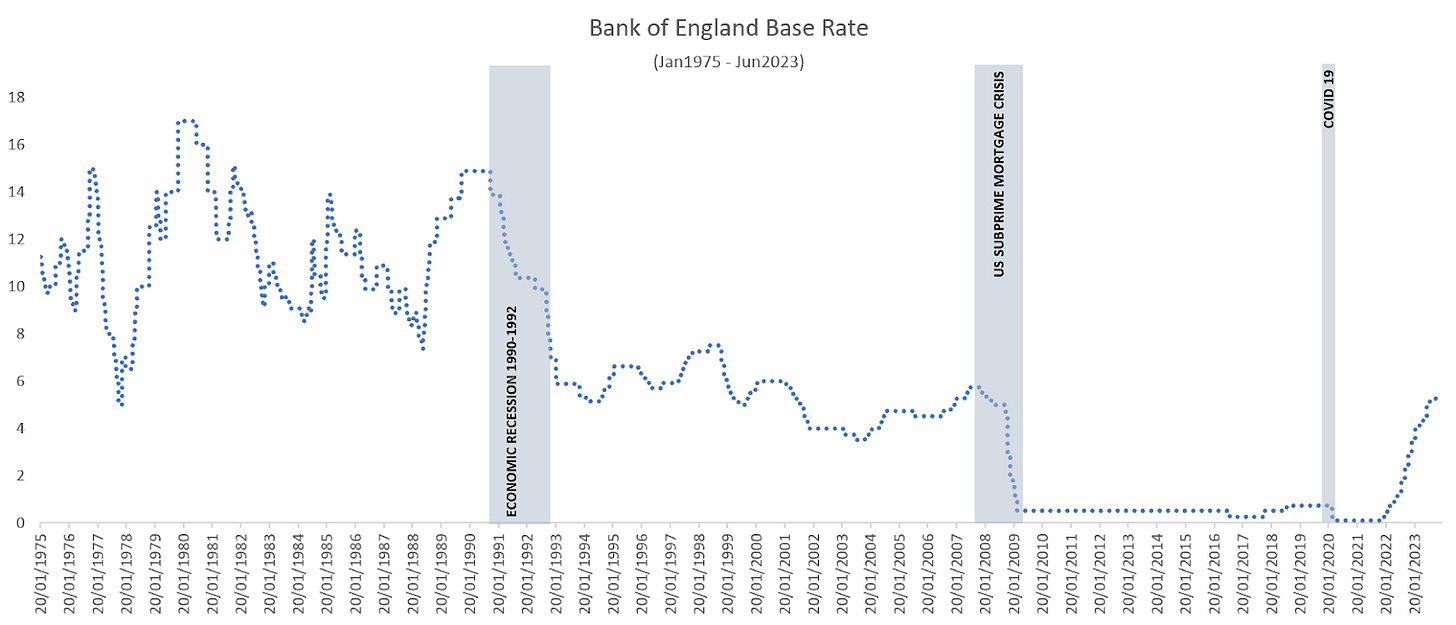
Our analysis suggests that inflation will remain the primary focal point, and it appears that the government's preferred instrument for addressing this is interest rates.

The last few months we have seen one of the most aggressive campaigns to increase the interest rate in history; however, as we head to base rate levels not seen since the subprime crisis it appears as if the BoE still has plenty of room to manoeuvre.


